Data analysis of developer job posts from Stack Overflow
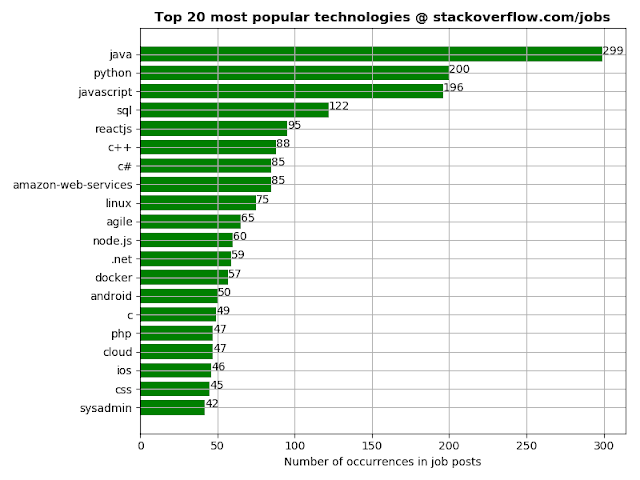
I did some data analysis on developer job posts from Stack Overflow with the aim of coming up with interesting insights about different aspects of job posts such as what are the most popular technologies, or the locations of job posts around the world as visualized on a map. After much data processing, I finally got the graphs I was looking for. I will show the most interesting graphs since there are too many to choose from and if you want to see the complete set of graphs, go to my personal website ; you will also find there explanations about how I managed to produce the data necessary to generate the graphs. The project is implemented in Python3 and makes use of a bunch of modules (e.g. BeautifulSoup4, matplotlib, plotly) for building the whole pipeline of generating the maps, graphs and reports. Contents 1. Sources of data and some initial stats 2. Bar chart: popularity of technologies based on number of occurrences in job posts 3. World map of job posts 4. Interactiv